UselessPickles
Making Grand Canyon replicas from air boxes...
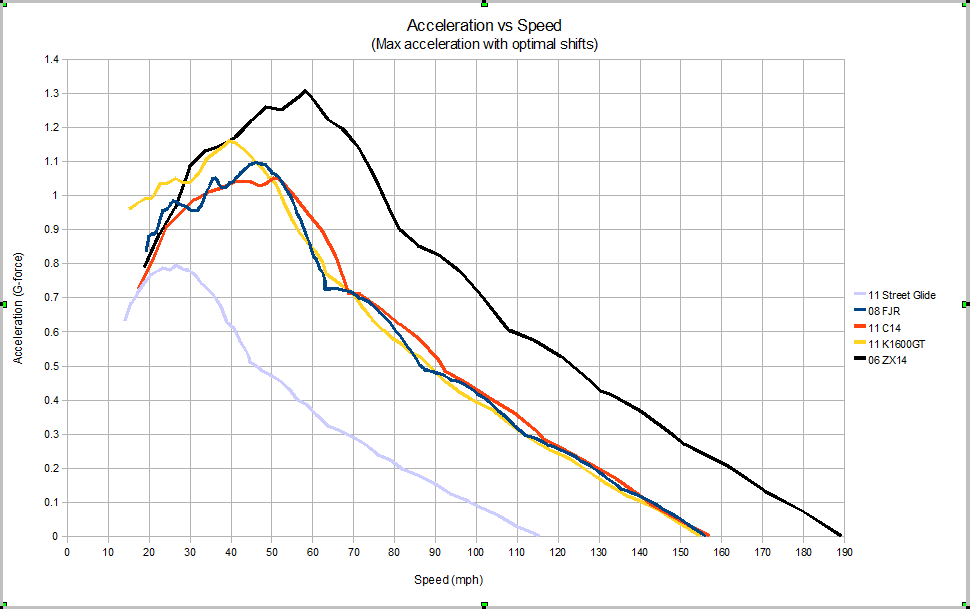
I'm slowly making progress on an application that will allow one to get meaningful performance data/comparisons about motorcycles based on torque chart data along with other critical info (weight, drag coefficient, gear ratios, etc.). Today, I worked on simulating acceleration over time. What better way to show off my work than with a simulated drag race between an FJR and C14?
So we're looking at a 2008 FJR vs a 2011 C14 (nothing has really changed since 2008 on the FJR, so a fair comparison). First, here's what most people and magazines focus on:
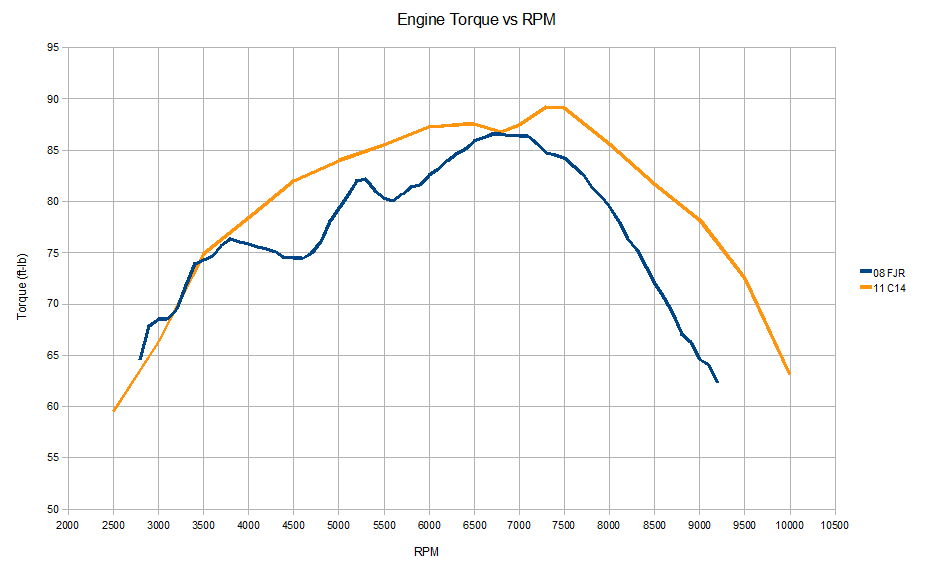
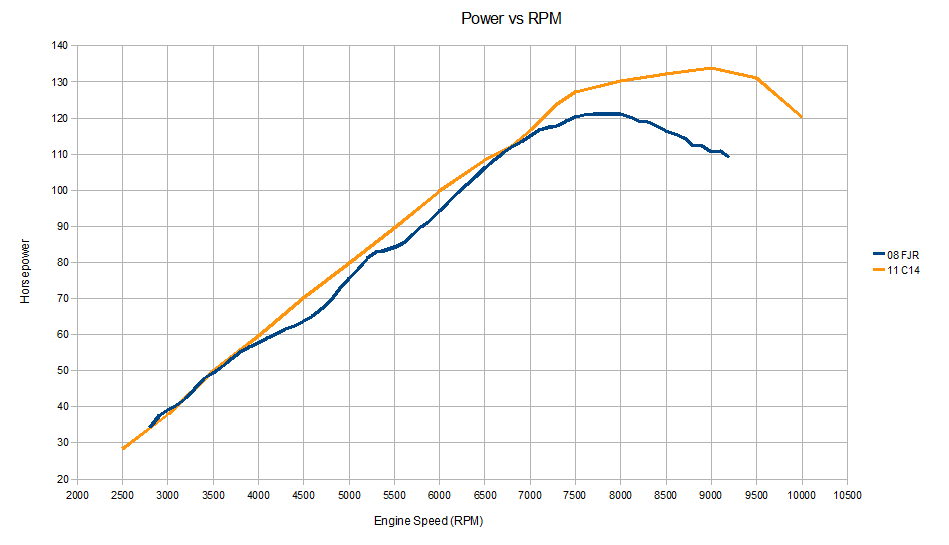
The good ol' torque and horsepower charts. It's hard to do any meaningful comparison between torque/horsepower charts of vehicles with different weights and transmission setups, but that doesn't stop people from endlessly debating old wives tales about torque vs. horsepower, and "where torque really matters", etc.
Now for a meaningful comparison. I simulate a 1/4 mile max acceleration run of both bikes. The calculations assume the weight of me on both bikes, a perfect launch with 100% throttle and the clutch modulated perfectly to hold the engine steady at each bike's peak torque RPM the entire time, perfect traction, and crisp gear shifts at the best possible times for max acceleration on each bike that are executed in 0.25 seconds. Essentially, this is the theoretical limit for best possible performance on these bikes.
And the winner is...
... (drum roll) ...
The C14!
C14: 10.71s @ 127.7mph; 0-60mph in 2.6s
FJR: 10.79s @ 126.7mph; 0-60mph in 2.5s
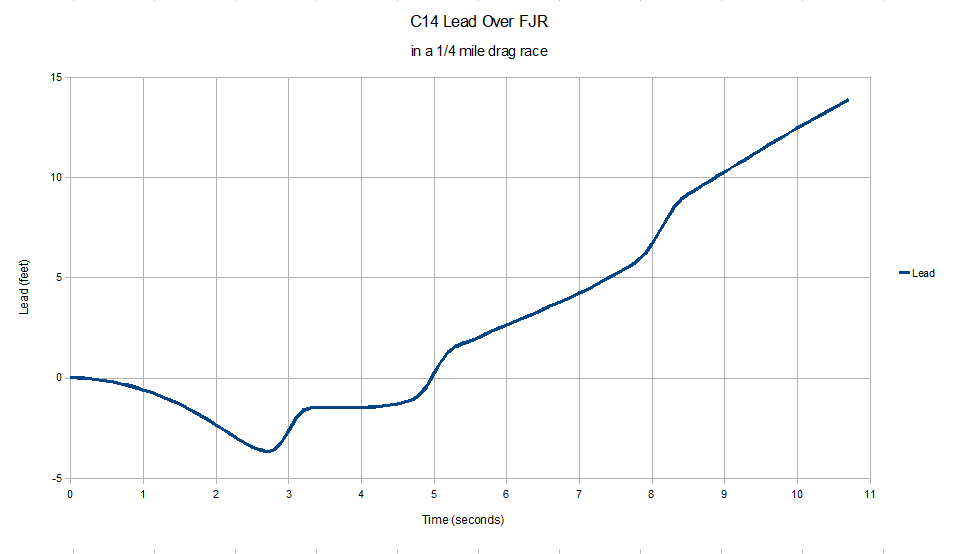
The C14 was ahead of the FJR by 13.9 feet at the end.
NOTE: The torque data used was SAE-corrected (sea-level, some standard pressure, cool temperature, low humidity, etc), so these are simulated best-possible corrected 1/4 mile times for these bikes.
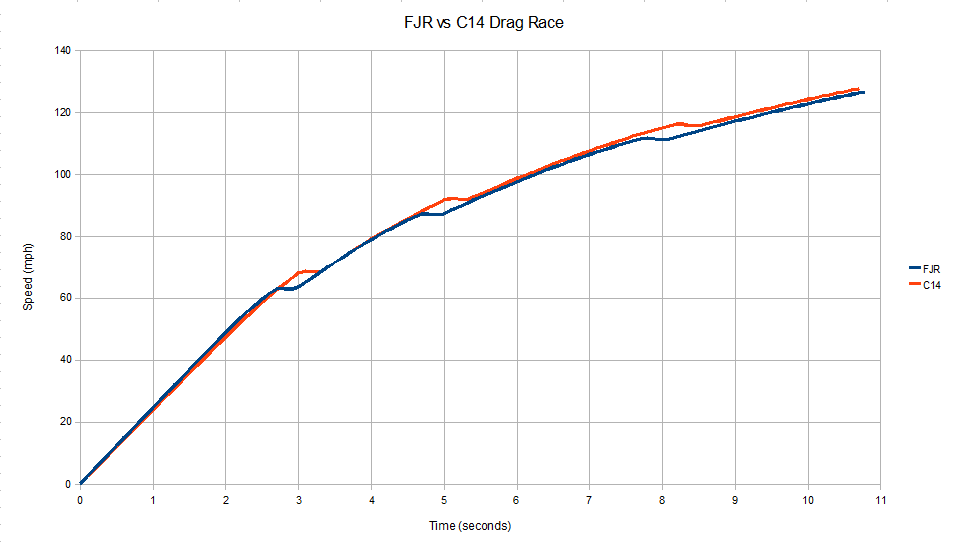
But that's not the full story. We can see exactly how it goes down by looking at graphs of various data. Here's a graph showing how both bikes accelerate over time. The gear shifts are quite obvious, and you can even see how the bikes slow down slightly while shifting due to drag.
And here's a look at the distance between the bikes throughout the race. The FJR launches ahead initially, but the C14 takes the lead as the FJR shifts into 3rd gear.
Isn't that much more interesting and informational than trying to compare torque or horsepower charts?
So who's going to try to work toward the theoretical best possible 1/4 mile run of 10.79s @ 126.7 mph on a stock Gen II FJR?
So we're looking at a 2008 FJR vs a 2011 C14 (nothing has really changed since 2008 on the FJR, so a fair comparison). First, here's what most people and magazines focus on:


The good ol' torque and horsepower charts. It's hard to do any meaningful comparison between torque/horsepower charts of vehicles with different weights and transmission setups, but that doesn't stop people from endlessly debating old wives tales about torque vs. horsepower, and "where torque really matters", etc.
Now for a meaningful comparison. I simulate a 1/4 mile max acceleration run of both bikes. The calculations assume the weight of me on both bikes, a perfect launch with 100% throttle and the clutch modulated perfectly to hold the engine steady at each bike's peak torque RPM the entire time, perfect traction, and crisp gear shifts at the best possible times for max acceleration on each bike that are executed in 0.25 seconds. Essentially, this is the theoretical limit for best possible performance on these bikes.
And the winner is...
... (drum roll) ...
The C14!
C14: 10.71s @ 127.7mph; 0-60mph in 2.6s
FJR: 10.79s @ 126.7mph; 0-60mph in 2.5s
The C14 was ahead of the FJR by 13.9 feet at the end.
NOTE: The torque data used was SAE-corrected (sea-level, some standard pressure, cool temperature, low humidity, etc), so these are simulated best-possible corrected 1/4 mile times for these bikes.
But that's not the full story. We can see exactly how it goes down by looking at graphs of various data. Here's a graph showing how both bikes accelerate over time. The gear shifts are quite obvious, and you can even see how the bikes slow down slightly while shifting due to drag.

And here's a look at the distance between the bikes throughout the race. The FJR launches ahead initially, but the C14 takes the lead as the FJR shifts into 3rd gear.

Isn't that much more interesting and informational than trying to compare torque or horsepower charts?
So who's going to try to work toward the theoretical best possible 1/4 mile run of 10.79s @ 126.7 mph on a stock Gen II FJR?
Last edited by a moderator:


